Veterans United in
Houston-Pasadena-The Woodlands, TX
The Houston housing market in October has weakened compared to last year with the median home price around $359,000 — down 1.6% from last year. Homes for sale in Houston* now spend an average of 52 days on the market, and nearly 33% sell below asking price, giving buyers more negotiating power.
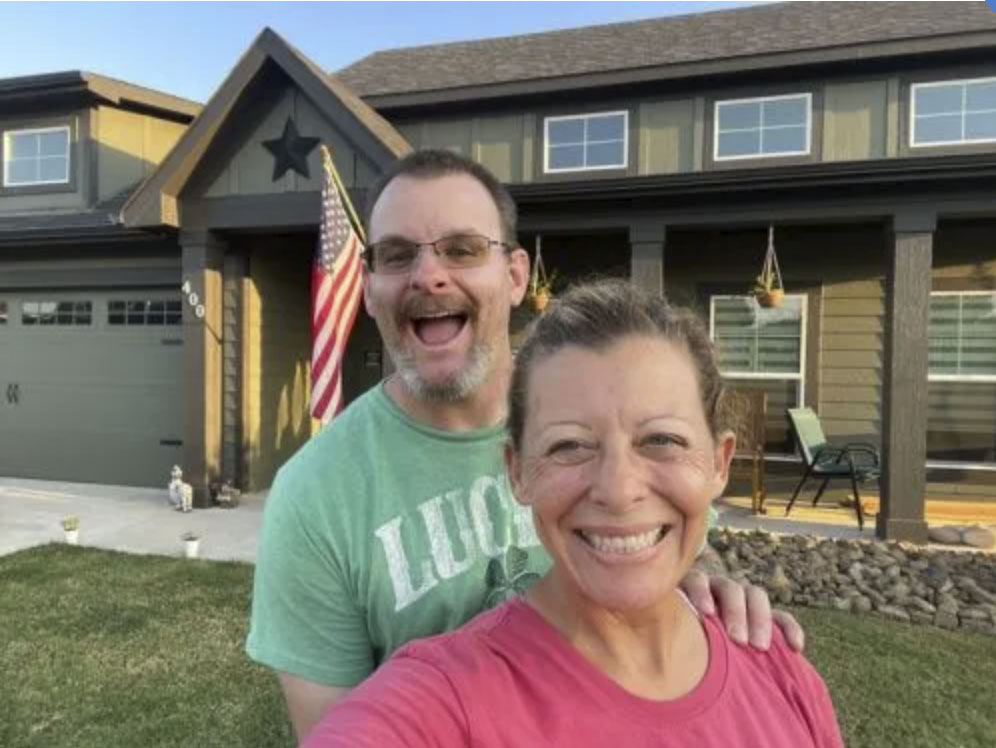
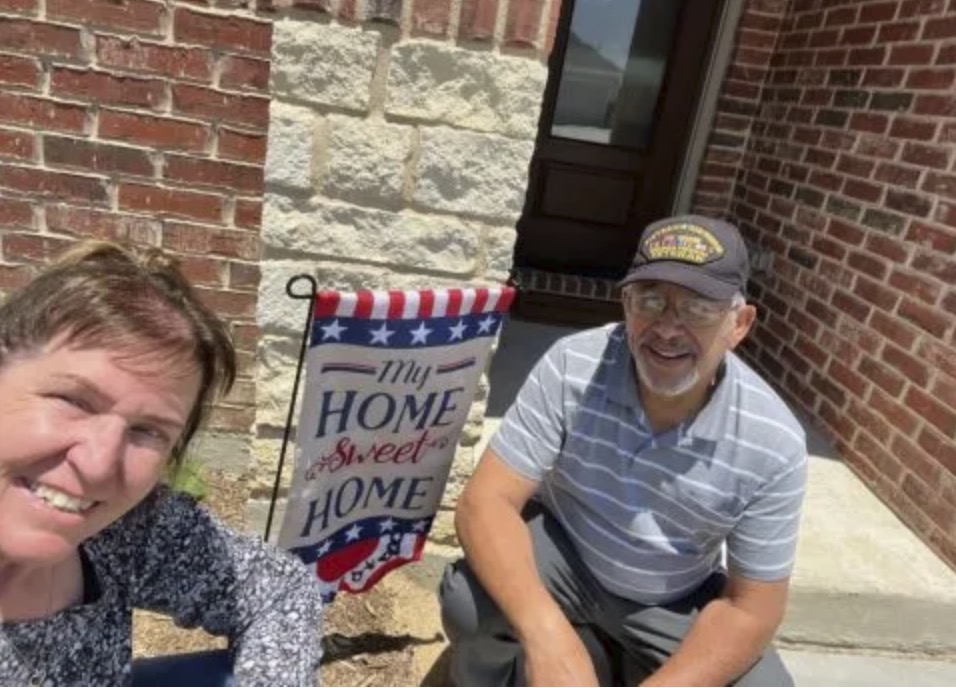
Just a few of the 836,073 Veterans we've helped get into homes.
9,457 Veterans in the Houston-Pasadena-The Woodlands, TX area alone!
Based on Veterans United and Veterans United Realty's internal data.
Andrey P. | U.S. Marine Corps
Ashley G. | U.S. Navy
Brett E. | U.S. Army
Jylene M. | U.S. Navy
Karl M. | U.S. Army
Johnny M. | U.S. Army
Santonio W. | U.S. Navy
Houston Metro Housing Market in September 2026
Median Days on Market
52 days
Homes are staying on the market 4% longer than last month.
Average Listing Price
$484,921
Average home prices are down 1.02% since last month.
Active Listings
35,920 homes
Number of houses on the market are up 0.89% since last month.
Homes in the Houston region sell at a moderate pace.
33% of listings reduced price last month.
9,512
New listings
Down 13.5% from last month
35,920
Active listings
Up 0.9% from last month
VA Loan Market Share
8% of originations last year were VA loans.
8,301
Sold last year
1/13
Were VA loans
Houston Area
Own vs Rent Trends
A higher share of owner-occupied homes often reflects stronger long-term ties to the community, since homeowners are more likely to stay in one place and invest in their neighborhoods. By contrast, areas with a larger renter population may be more transient, offering flexibility but sometimes less stability in housing markets.
It could also be an indication of market health, as affordable markets often have higher owner-occupancy rates.
The home listing price-to-income ratio in the Houston area is 4.5
The ratio compares how expensive homes are in Houston relative to household income. A higher ratio means homes cost more compared to what people earn.
A healthy price-to-income ratio is generally around 3 times your household's annual income (or less), but higher ratios can be sustainable depending on your rate, DTI, and more.
Median Home Prices by Neighborhood in the Houston Region
This section breaks down median home prices by neighborhood. Use these insights to see where housing costs trend higher or lower, and to better understand the market at the zip code level.
The Houston metro median income is $79,463.
Explore Houston Area Neighborhoods
See how median home prices in individual Houston neighborhoods compare to the overall metro median.
View this chart to learn about the median listing price and the number of active listings in Houston over time.
Month
Nov 2022
Dec 2022
Jan 2023
Feb 2023
Mar 2023
Apr 2023
May 2023
Jun 2023
Jul 2023
Aug 2023
Sep 2023
Oct 2023
Nov 2023
Dec 2023
Jan 2024
Feb 2024
Mar 2024
Apr 2024
May 2024
Jun 2024
Jul 2024
Aug 2024
Sep 2024
Oct 2024
Nov 2024
Dec 2024
Jan 2025
Feb 2025
Mar 2025
Apr 2025
May 2025
Jun 2025
Jul 2025
Aug 2025
Sep 2025
Oct 2025
Nov 2025
Dec 2025
Jan 2026
Feb 2026
Mar 2026
Apr 2026
May 2026
Jun 2026
Jul 2026
Aug 2026
Listing Price
$362,745
$359,900
$354,638
$358,250
$360,831
$372,000
$375,000
$378,650
$376,000
$374,950
$369,990
$369,383
$365,000
$359,900
$359,000
$359,990
$362,675
$369,900
$370,000
$372,900
$374,938
$375,000
$370,000
$369,450
$365,000
$361,405
$359,000
$358,000
$365,000
$369,900
$372,500
$374,925
$370,000
$365,000
$359,950
$358,000
$354,999
$350,000
$349,900
$349,999
$350,500
$359,897
$360,000
$362,265
$360,000
$359,000
Month
Nov 2022
Dec 2022
Jan 2023
Feb 2023
Mar 2023
Apr 2023
May 2023
Jun 2023
Jul 2023
Aug 2023
Sep 2023
Oct 2023
Nov 2023
Dec 2023
Jan 2024
Feb 2024
Mar 2024
Apr 2024
May 2024
Jun 2024
Jul 2024
Aug 2024
Sep 2024
Oct 2024
Nov 2024
Dec 2024
Jan 2025
Feb 2025
Mar 2025
Apr 2025
May 2025
Jun 2025
Jul 2025
Aug 2025
Sep 2025
Oct 2025
Nov 2025
Dec 2025
Jan 2026
Feb 2026
Mar 2026
Apr 2026
May 2026
Jun 2026
Jul 2026
Aug 2026
Active Listings
21,230
20,162
18,699
17,766
17,407
17,137
17,318
18,393
19,673
20,110
20,808
21,752
22,095
21,529
20,401
20,655
21,518
22,668
23,993
25,789
26,641
26,547
27,052
27,475
27,609
26,614
25,879
26,655
28,302
30,583
32,712
34,226
35,273
35,151
34,077
33,947
33,764
31,350
29,683
30,462
31,970
32,681
33,872
34,721
35,603
35,920
Median Days on Market
Days on Market
This chart shows the median days on market for active listings over time. In other words: how quickly homes move in the market. A declining rate means rising competition among buyers, while an increase means listings are sitting longer.
Month
Nov 2022
Dec 2022
Jan 2023
Feb 2023
Mar 2023
Apr 2023
May 2023
Jun 2023
Jul 2023
Aug 2023
Sep 2023
Oct 2023
Nov 2023
Dec 2023
Jan 2024
Feb 2024
Mar 2024
Apr 2024
May 2024
Jun 2024
Jul 2024
Aug 2024
Sep 2024
Oct 2024
Nov 2024
Dec 2024
Jan 2025
Feb 2025
Mar 2025
Apr 2025
May 2025
Jun 2025
Jul 2025
Aug 2025
Sep 2025
Oct 2025
Nov 2025
Dec 2025
Jan 2026
Feb 2026
Mar 2026
Apr 2026
May 2026
Jun 2026
Jul 2026
Aug 2026
Median Days on Market
52
60
65
55
49
44
41
40
40
42
44
46
50
56
59
48
43
43
38
40
46
51
48
50
52
59
62
54
45
44
44
46
50
51
56
57
57
64
66
54
50
48
49
50
50
52
Market Hotness Score
Market Hotness
Based on Realtor.com's Market Hotness Index, this measure reflects how competitive the housing market is by comparing buyer demand with available inventory. Rising hotness scores point to more competition, while declining scores signal cooling conditions.
Month
Nov 2022
Dec 2022
Jan 2023
Feb 2023
Mar 2023
Apr 2023
May 2023
Jun 2023
Jul 2023
Aug 2023
Sep 2023
Oct 2023
Nov 2023
Dec 2023
Jan 2024
Feb 2024
Mar 2024
Apr 2024
May 2024
Jun 2024
Jul 2024
Aug 2024
Sep 2024
Oct 2024
Nov 2024
Dec 2024
Jan 2025
Feb 2025
Mar 2025
Apr 2025
May 2025
Jun 2025
Jul 2025
Aug 2025
Sep 2025
Oct 2025
Nov 2025
Dec 2025
Jan 2026
Feb 2026
Mar 2026
Apr 2026
May 2026
Jun 2026
Jul 2026
Aug 2026
Hotness Score
25.9197
32.4415
38.2943
35.1171
28.7625
26.2542
23.0769
25.0836
26.9231
25.5853
25.9197
24.7492
25.7525
32.2742
38.2943
35.786
30.9365
23.913
22.7425
20.903
21.0702
18.8963
28.7625
27.9264
31.9398
36.2876
38.9632
35.4515
33.612
26.2542
24.5819
27.7592
28.4281
29.7659
27.7592
28.0936
31.4381
34.7826
37.7926
35.9532
28.9298
24.2475
21.2375
25.4181
28.0936
28.5953
Pending Homes-for-Sale %
Percentage of Homes Sold per Month
This chart shows the percentage of homes that sold each month, highlighting buyer demand and long-term market trends. In most markets, around 20% of listings selling each month is considered balanced. Higher percentages point to a strong sellers' market, while lower percentages indicate more favorable conditions for buyers.
Largest overall VA lender (purchase and refinance) for four consecutive years.
More VA purchase loans than any other lender for the past 10 consecutive years
Over the last six fiscal years, Veterans United made more VA purchase loans than USAA, Navy Federal Credit Union, Rocket Mortgage, Wells Fargo and Freedom Mortgage combined.
We have 1,521 Veterans ready to buy your home right now!
Neighborhoods like Tomball, Cypress, Conroe and Katy have stood out for VA buyers in the Houston area thanks to their proximity to VA medical care, entertainment and strong Veteran communities. Stay competitive by doing your homework, and make sure you find a home you can afford. Preparation makes all the difference.
Manu D.Veterans United Network Realty Agent
Houston is a big, diverse market. A buyers should know how much of a difference it makes to work with an agent and lender who truly understand the VA process and state-level veteran benefits. That expertise can be the difference between a smooth closing and a stressful one.
Julie R.Veterans United Network Realty Agent
1-800-985-5723 | 1512 Heriford Road, Columbia, MO 65202. Not affiliated with any government agency including the VA. Missouri Licensed Real Estate Brokerage; for license information, visit VeteransUnitedRealty.com. Equal Housing Opportunity.
Start Your VA Loan With Veterans United
Not sure where to begin? Whether you're stationed nearby or planning to move near Houston, we’ll help you understand what to expect.
Danny Leo's and his team. OUTSTANDING and on point with every step of the way. Kept me informed from beginning to end of the whole buying process. Thank you for the gift box. Thank you to the whole Veterans United Realty team. 🥰🥰🥰
Bertha W. | Army
Verified Customer
the whole team was outstanding!!! kept us in the loop during the buying process!!!
Thomas A. | Army
Verified Customer
The folks at Veterans United from the start to the finish were there working with me to find my home . Recommending a Realtor and keeping me apprised of each step . I was amazed at closing in 30 days was even possible. I would recommend them 100%.
Fermis H. | Marine Corps
Verified Customer
Bryant and his team have gone above and beyond for every step this taxing process demanded, and has been supportive across each and every obstacle we encountered. I could not have wished for a better team to help me through this major life milestone.
Taylor S. | Marine Corps
Verified Customer
Everyone was professional,patient,understanding, and loved how it was a one stop shop. Made everything easy for me. This experience of becoming an homeowner and working with Veterans United will forever be remembered and I will always cherish and tell people how amazing this company is.
Victor A. | Navy
Verified Customer
Bobby was excellent to work with. Always there when needed and cared about my concerns. This is the second time I have used veterans united and will definitely use them in the future. Very easy process, just sit back and relax. They take care of it all. Literally even helping set up utilities.
Christian R. | Army
Verified Customer
The entire staff is amazing my entire process was seemless and stress free
Reginald B. | Air Force
Verified Customer
Awesome. It was a pleasure working with my mortgage team, phil and nicks team at VU where so great ! they understood the first place didn’t work out and speedily worked on getting the paperwork fixed so I could close fast on a new property I had found. Which is honestly better than the first one.T...
Justin R. | Army
Verified Customer
Great experience. 99% of everything was done over the app.
Mark R. | Marine Corps
Verified Customer
The customer service, professionalism and knowledge of the VA home loan procedures was outstanding. I was going to use another mortgage company but after this experience with Veterans United I will always go with them in the future!
Miguel N. | Army
Verified Customer
Do y’all even have Whataburger? Veterans United is better than a honey butter chicken biscuit. My experience has been so awesome from start to finish. I felt so attended to and I definitely needed that from the team. I can’t wait until I have family or friends in need that can see for themselves...
Dana H. | Air Force
Verified Customer
Alan and his team were great to work with! I would absolutely recommend them to all my veteran buddy’s! Even when things got difficult for us they had our back and helped us persevere! Thank you for that!!!
Jason C. | Navy
Verified Customer
Awesome service they make a difficult process smooth.
*Unless stated otherwise, data for the metro refers to the CBSA ("Core-Based Statistical Area"), the defined geography that makes up the surrounding metropolitan and micropolitan areas.
Cookies and Related Technologies
Notice of Right to Opt-Out of Sale/Sharing
Your Privacy Choices
You can always choose to opt out of us sharing your name, email address, or other personal information with third parties for advertising purposes.
Cookies are small text files that store bits of information (such as usernames or preferences) to help recognize your device. We use cookies to keep our site running properly and to enhance your experience.
You can manage your cookie preferences at any time, including turning off advertising cookies. Please note that disabling some cookies may impact your experience on the site. Essential cookies, which are necessary for basic site functions, cannot be turned off.